Follow the Sun: A US Trader's Framework for Profiting From Bitcoin's Global Liquidity Cycle
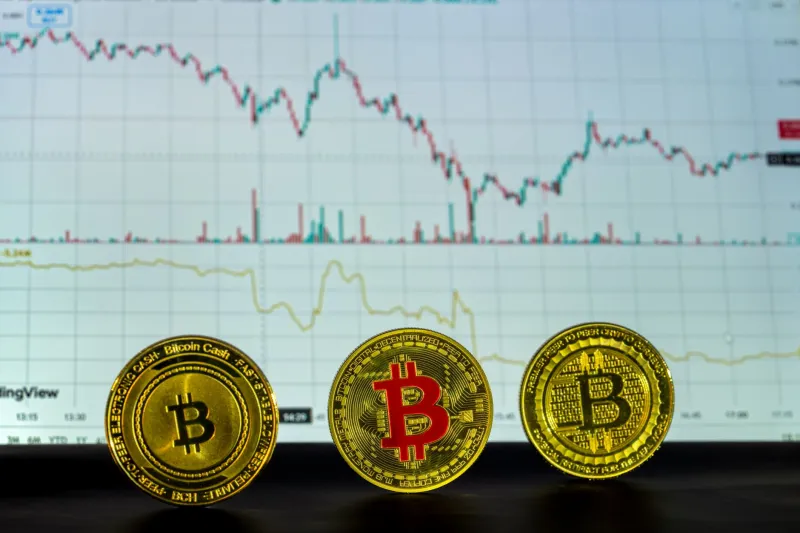
Bitcoin's 24-hour trading cycle is often cited as a feature that distinguishes it from traditional financial markets. What that description obscures is the fact that liquidity, volatility, and directional bias are distributed unevenly across those 24 hours—and the distribution follows a consistent geographic logic tied to the opening and closing rhythms of markets in Asia, Europe, and the United States.
For US-based traders, understanding that cycle is not an academic exercise. It is a practical framework for timing entries, anticipating reversals, and avoiding the low-liquidity traps that punish traders who treat all hours as equivalent.
The Architecture of a Global Bitcoin Trading Day
To understand Bitcoin's geographic price behavior, it helps to map the major liquidity windows against Eastern Time, which serves as the reference frame for most US-based participants.
The Asian session runs roughly from 8:00 PM to 4:00 AM ET, anchored by trading activity in Japan, South Korea, and increasingly Singapore and Hong Kong. Japanese retail participation through platforms like bitFlyer and Coincheck has historically been significant, and Korean premium dynamics—the so-called Kimchi Premium—have at various points diverged meaningfully from global spot prices.
The European session opens around 3:00 AM ET and reaches peak activity between 4:00 AM and 8:00 AM ET, as London desks come online. European institutional flow, including activity from regulated funds operating under MiCA-adjacent frameworks, tends to be more systematically driven than Asian retail flow.
The US session, beginning with the pre-market window around 8:00 AM ET and accelerating at the 9:30 AM equity open, brings the largest single-geography liquidity pool into play. US-based institutional desks, ETF arbitrage activity, and the correlation effects of equities and macro data releases all concentrate in this window.
What the Data Shows About Geographic Price Behavior
Historical analysis of Bitcoin's hourly returns reveals several durable patterns worth incorporating into a trading framework.
The Asian session is characterized by lower average volume relative to the US window, but it is disproportionately responsible for sharp directional moves that occur without obvious catalyst. This is partly a function of thinner order books—large orders move price more in low-liquidity environments—and partly a function of the retail-heavy composition of Asian participation, which tends to respond more sharply to momentum signals.
The European open, particularly the 3:00 AM to 5:00 AM ET overlap with the tail of the Asian session, has historically been associated with trend continuation or sharp reversal of Asian-session moves. European institutional desks often fade Asian retail momentum, and the resulting price action during this overlap window can set the directional tone for the subsequent US session.
The US session itself tends to amplify whatever direction was established during the European overlap, particularly when macroeconomic data releases—CPI, FOMC statements, payroll reports—coincide with the window. The correlation between Bitcoin and US equity index futures has increased materially since the introduction of Bitcoin ETFs, meaning that the 9:30 AM ET equity open now carries more weight for BTC price action than it did in earlier market cycles.
Order Book Positioning Across Exchanges
One of the more actionable aspects of geographic liquidity analysis involves monitoring order book depth across exchanges that serve different regional audiences. Platforms with heavy Asian user bases often show distinct bid-ask structures during the Asian session that can signal short-term directional intent.
When large limit orders accumulate on the bid side of a predominantly Asian exchange during the late Asian session, and that positioning is not mirrored on US-facing platforms like Coinbase or Kraken, it can indicate that regional participants are positioning for upside ahead of the European open. The reverse pattern—heavy ask-side accumulation on Asian platforms into the European open—has historically preceded short-term selling pressure as European desks absorb and then fade that supply.
Tools that aggregate order book data across exchanges allow traders to observe these cross-regional imbalances in near real time. Platforms offering aggregated liquidity views across Binance, OKX, and Coinbase simultaneously provide a more complete picture than any single exchange's depth chart.
Building a Rules-Based Framework for US Traders
The following framework synthesizes these observations into actionable decision criteria for US-based participants.
Asian Session (8 PM – 4 AM ET): Treat this window as an intelligence-gathering phase rather than a primary trading window, unless a significant directional move with strong volume occurs in the first two hours. Sharp moves in this window on thin volume are frequently mean-reverting by the European open.
European Open (3 AM – 5 AM ET): This is the highest-signal overlap window for anticipating US session direction. If European flow confirms the Asian session's direction with increasing volume, the probability of continuation into the US session is elevated. If European flow reverses Asian session direction with strong volume, the reversal is more likely to hold.
Pre-US Open (7 AM – 9:30 AM ET): Bitcoin's behavior in this window relative to S&P 500 futures provides a directional read. Divergence between BTC and equity futures during this window—where BTC moves sharply in a direction not confirmed by equity futures—has historically tended to resolve in favor of the equity futures direction once the US cash session opens.
US Session (9:30 AM – 4 PM ET): The highest-volume, highest-liquidity window. Price discovery is most reliable here. Breakouts from ranges established during the Asian and European sessions that occur on elevated volume during the US session carry the highest continuation probability.
The Practical Edge in Geographic Awareness
Most retail traders in the United States operate exclusively within US waking hours, effectively ignoring more than half the Bitcoin trading cycle. That narrow focus creates blind spots—positions entered without understanding where price came from geographically often encounter unexpected resistance or support that would have been visible to a trader monitoring global order flow.
Geographic liquidity awareness does not require trading at 3:00 AM. It requires reviewing what happened during the Asian and European sessions before making decisions during the US window. That review, conducted systematically, provides context that raw price charts alone cannot supply.
At TNA BTC, the conviction is straightforward: Bitcoin is a global asset, and traders who analyze it as though it only exists during US business hours are working with an incomplete map.